
Don’t Drive Forward Looking in Your
Rearview Mirror
by A. Scott White, CFP®, ChFC®, CLU®
President, Scott White Advisors
After a disappointing year in 2015 for major stock market indexes, I understand why investors would want to compare their investment portfolio performance to the indexes. But I would strongly urge investors not to believe there is any real meaningful conclusion that could be derived from this simple comparison. Just as meaningless as a one-year investment performance comparison is in a well-diversified investment portfolio designed to meet an investor’s goals, so are the 3-year, 5-year and 10-year comparisons. After all, these comparisons have nothing to do with how investments might perform in the future or how a well-planned portfolio strategy might provide investors the best chance of reaching investment goals regardless of past experience.
Let’s take a look at what the 10-year investment return number actually measures. Many individuals believe the 10-year investment return gives a good representation of what an investor might expect in the future from investing in this (one cannot invest directly in an index) or similar investments. The thinking is that over a 10-year period, this number would include a complete investment cycle, including periods of both growth and recession. It is assumed that 10 years is such a lengthy period that any one year would have little impact on the 10-year average investment return. Nothing could be further from the truth. We must remember that the 10-year investment return is actually measuring the return between two points in time. Let’s take a look at the rolling 10-year investment returns of the S&P 500 index since 1980.
2016 FactSet Research Systems Inc.
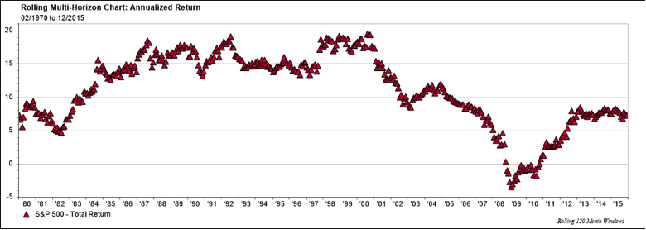
This graph is not a reliable indicator of what might happen. The 10-year investment return actually goes up and down in large movements in relatively short periods of time. The 10-year investment returns went from 19.49% in August 2000 to less than half, or 8.53%, by March 2003. Notice the 10-year average return is actually negative from November 2008 to October 2010. So how could any investor in 2000 actually glean any useful information from the 10-year investment return figure?
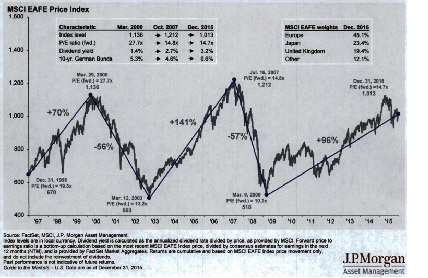
The danger here is that many investors do look at the 10-year return figure and assume the figure is providing a clue of what to expect in the future. Let’s take international investing as an example. A common index for measuring international stock market returns is the MSCI EAFE Price Index, EAFE. In this chart, the EAFE index peaks on July 16, 2007 at 1,212 and closes at 1,013 on December 31, 2015. Although the index is up 96% since March 9, 2009, if the EAFE index does not rise another 200 points before 2017, it will post a negative 10-year return. Once that happens, many investors may choose to stay away from foreign stock markets altogether, fearing negative investment returns. But looking forward, if the EAFE index stays at 0% return, by 2018 the 10-year investment return will look quite positive, not because of spectacular performance going forward, but because the index peak of 2007 will no longer be the starting point in the 10-year return calculation. The starting point years ago is just as important a part of calculating any investment’s return as the end point, but many investors don’t understand this.
With the 2016 global stock markets off to a rocky start, how likely is the EAFE index to increase by 200 points, averting a potential 10-year negative return number? Who knows? But I know that anyone avoiding investing in international stock markets based on the EAFE index’s 10-year rate of return could wind up making a big mistake. Please consider these findings1:
1. Over the past 10 years, most best-performing stocks have come from outside the U.S. Since 2004, 79 of the 100 best-performing stocks in the world have been outside the U.S.2
2. Forward-looking earnings per share (EPS) estimates point to better earnings in non-U.S. companies. Projected EPS growth for the next five years is expected to be about the same in the U.S. as the past five years, while substantial increases are forecast for Europe, the Middle East/Africa and Latin America.3
3. Global growth as measured by gross domestic product (GDP) is expected to outpace U.S. growth in the U.S.4
4. Over different time periods, international equities have outperformed U.S. equities. Since 2000, global portfolios have outperformed
U.S.-centric portfolios over rolling 10-year periods 80% of the time.5
This information seems much more valuable when building an investment portfolio to meet an investor’s goals than knowing the 10-year average of an index which may look completely different in a couple of years.
Often the real damage disappointing investment returns causes is investors becoming emotionally disappointed and thus tempted to give up on a sound investment strategy—to chase an investment just coming off a period of strong performance, only to find out later about the low probability for the investment to repeat the past. In other words, one would never consider driving a car down a road by looking solely in the rearview mirror. It is much more important to know the direction the car is traveling—not where it has been. Put another way, I am not concerned about the airport the plane I’m about to board came from, but I am very concerned about the next destination where the plane is scheduled to arrive.

1 Five myths of international investing – and how to overcome them. Wells Fargo Insight Guide, October 2015.
2 Source: MSCI ACWI in dollar terms as of June 30, 2015.
3 Source: FactSet and Wells Fargo Asset Management, as of June 30, 2015.
4 Data provided by IMF as of June 30, 2015.
5 Past performance is no guarantee of future results. Sources: MSCI ACWI in dollar terms and the MSCI USA index.
The information contained in this report does not purport to be a complete description of the securities markets or developments referred to in this material. The information has been obtained from sources considered to be reliable, but we do not guarantee that the foregoing materials are accurate and complete. Any opinions are those of Scott White Advisors and not necessarily those of RJFS or Raymond James. Expressions of opinion are as of this date subject to change without notice. Past performance may not be indicative of future results. Any information is not a complete summary or statement of all available data necessary for making an investment decision and does not constitute a recommendation. Strategies discussed may not be suitable for all investors. Investing involves risk and investors may incur a profit or loss regardless of strategy selected. Diversification does not ensure a profit or guarantee against a loss.
The S&P 500 is an unmanaged index of 500 widely held stocks that is generally considered representative of the U.S. stock market. The MSCI EAFE Index measures international performance and comprises 21 MSCI country indices, representing the developed markets outside of North America: Europe, Australia and the Far East. Keep in mind that individuals cannot invest directly in any index, and index performance does not include transaction costs or other fees, which will affect actual investment performance. Individual investor’s results will vary. Raymond James and its advisors do not offer tax or legal advice. You should discuss any tax or legal matters with the appropriate professional.